Fidelity MSCI Information Technology Index ETF (FTEC)
$277.23
Quotes are delayed by 15 minutes.
1D
1W
1M
3M
6M
YTD
1Y
2Y
5Y
ALL
Key data on FTEC
AUM
$21.53B
P/E ratio
32.1
Dividend yield
0.3275%
Expense ratio
0.084%
Beta
1.340717
Price on FTEC
Previous close
$268.43
Today's open
$270.09
Day's range
$268 - $277.70
52 week range
$184.88 - $300.79
Popular funds like FTEC
FTEC industries and sectors
Industries
Technology
Top holdings in FTEC
NVDA
Nvidia Corp.
18.25%
AAPL
Apple Inc
16.02%
MSFT
Microsoft Corp
10.29%
AVGO
Broadcom Inc
4.32%
2.01%
A1MD34F:BV
Advanced Micro Devices Inc
1.76%
1.72%
1.7%
A1MT34:BV
Applied Materials Inc
1.45%
1.42%
News on FTEC
FTEC vs. IYW: Is the Better Tech ETF Buy Also the Cheaper One?
FTEC carries a significantly lower expense ratio of 0.08% compared to 0.38% for IYW. Both funds are highly concentrated in the technology sector, but FTEC holds more than double the number of securities found in IYW.
The Motley Fool • Jun 11, 2026
Forget VOO: Fidelity's Tech ETF Is Up 29% While the Broad Market Lags
A $10,000 position in Fidelity MSCI Information Technology Index ETF (NYSEARCA:FTEC) on the last trading day of 2025 was worth about $12,480 by the close on June 8, 2026, a gain that arrived in roughly five months while the broad market did something far more modest.
24/7 Wall Street • Jun 10, 2026

EU targets Big Tech dependence with 'made-in-Europe' drive
The European Commission proposed new laws on Wednesday to boost domestic cloud, AI and semiconductor industries, aiming to cut reliance on U.S. Big Tech in a move that could ratchet up transatlantic tensions.
Reuters • Jun 3, 2026
Europe unveils tech sovereignty package amid growing concerns over reliance on U.S. tech
The proposals include a new act to bolster advanced chip manufacturing and homegrown cloud computing.
CNBC • Jun 3, 2026

FTEC And The Illusion Of Expected Valuations You Need To Know
The Fidelity MSCI Information Technology Index ETF remains a representative, low-cost, diversified tech sector solution, but current valuations warrant caution. FTEC's performance and risk profile are heavily concentrated in a few mega-cap names, notably NVDA (17.32%) and AAPL (14.80%), driving sector returns. Aggregate forward P/E appears reasonable, but excluding top contributors, underlying valuations are stretched and sector growth is less robust.
Seeking Alpha • Jun 2, 2026

FTEC: You Don't Need Stock Picking In Tech, Just This ETF
The Fidelity MSCI Information Technology Index ETF offers broad, low-cost passive exposure to the U.S. tech sector and is rated a BUY. FTEC stands out for its low 0.08% expense ratio, tight benchmark tracking, and strong historical outperformance versus the S&P 500. The ETF is highly concentrated in mega-cap tech, with the top 3 holdings — Nvidia, Apple, Microsoft — comprising 41.86% of assets, presenting concentration risk.
Seeking Alpha • Jun 2, 2026

2 Sectors Where the Ultra-Wealthy Are Putting Their Money
Family offices poured more than $3 billion into tech, media, and telecom companies. But materials attracted the most capital—$4.8 billion.
Barrons • May 23, 2026

Buy These ETFs as NVIDIA Posts Record Q1 Revenues, Beats on Earnings
NVIDIA's post-earnings dip spotlights ETFs loaded with NVDA exposure as investors weigh booming AI demand against supply-chain risks.
Zacks Investment Research • May 22, 2026

Tech ETFs to Buy as Microsoft, Anthropic Eye Custom AI Chip Deal
Microsoft's Maia AI chip talks with Anthropic spotlight tech ETFs as a diversified way to tap the AI-driven custom silicon boom.
Zacks Investment Research • May 22, 2026
We have had an ‘overweight waiting' on the IT sector since 2022: CFRA Research senior VP
CFRA Research senior vice president and head of technology Angelo Zino explains why Nvidia, AMD, Microsoft and Meta remain top ‘strong buy' picks amid the ongoing AI-driven tech rally on ‘Making Money.'
Fox Business • May 22, 2026

¹ Disclosures
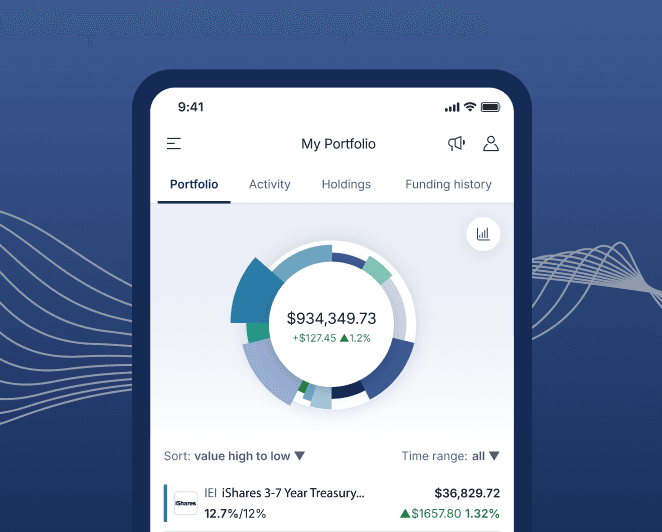
Invest in Fidelity MSCI Information Technology Index ETF
Open an M1 investment account to buy and sell Fidelity MSCI Information Technology Index ETF commission-free¹. Build wealth for the long term using automated trading and transfers.